數據庫分析 x 技術指標:打造穩健量化決策框架的關鍵
AI 革命浪潮下,如何運用大數據與技術指標建構可重複驗證的量化決策系統?本文從教育角度出發,剖析數據庫分析在量化交易中的核心角色,並分享提升策略開發效率的實用方向。
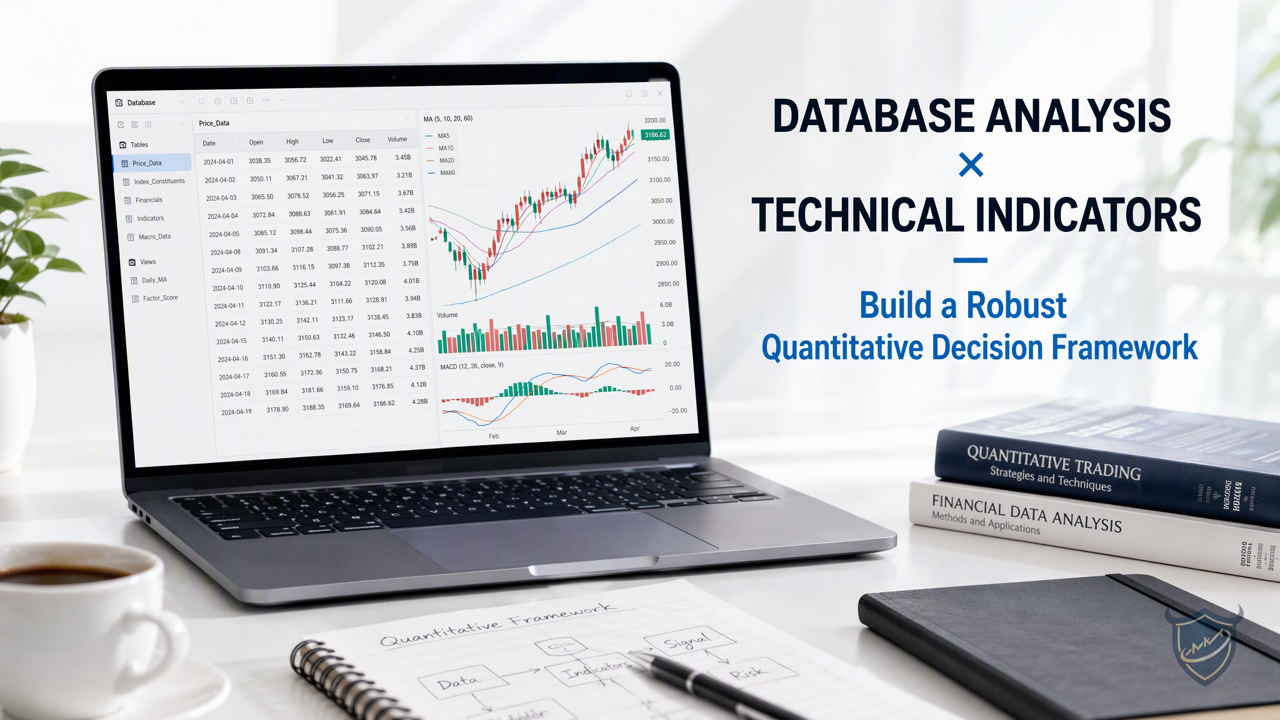
Introduction: Quantitative Breakthrough in the AI Revolution
Recently, market attention on big data and quantitative models has been heating up. The AI revolution is driving quantitative trading into a new phase. In the decision-making process, the combination of database analytics and technical indicators has become the key to building a robust quantitative framework. This article takes an educational perspective to explore how to extract valuable statistical features from public market data and combine them with technical indicators to construct a repeatable and verifiable decision system.
The Role of Database Analytics in Quantitative Trading
Database analytics is the cornerstone of quantitative trading. It not only efficiently processes massive historical data but also uncovers potential statistical patterns. For intermediate quantitative learners, mastering database analytics skills means being able to validate strategy ideas faster and improve development efficiency.
Functional Benefits: Enhanced Data Processing Speed
Traditional data processing methods are often limited by tools and architecture, making it difficult to handle high-frequency or large-scale data queries. Modern database analytics tools, such as columnar storage and distributed computing, can significantly enhance data processing speed, allowing researchers to complete complex aggregation and filtering operations in a short time.
Uncovering Potential Patterns
Through database analytics, we can perform multi-dimensional statistics on historical prices, trading volumes, and other data, such as calculating rolling volatility and correlation matrices. These statistical features help identify changes in market conditions and provide a foundation for subsequent application of technical indicators.
Calculation Logic and Application Scenarios of Technical Indicators
Technical indicators are an important component of quantitative decision systems. They transform raw data such as prices and volumes into easily interpretable signals. Below are several common indicators with their calculation logic and application scenarios.
Moving Average (MA)
The moving average is one of the most basic technical indicators. It smooths short-term fluctuations by calculating the average price over a certain period, reflecting the trend direction. For example, the crossover of the 50-day and 200-day moving averages is often used to judge long-term trend changes.
Relative Strength Index (RSI)
RSI measures overbought or oversold conditions by comparing average gains and losses over a period. The formula is: RSI = 100 - (100 / (1 + RS)), where RS is the ratio of average gain to average loss. An RSI above 70 is typically considered overbought, while below 30 is oversold.
Bollinger Bands
Bollinger Bands consist of a moving average and two standard deviation channels above and below it, used to measure price volatility range. When the price touches the upper band, it may indicate overbought; touching the lower band may indicate oversold.
Building a Repeatable and Verifiable Decision Framework
To build a robust quantitative decision framework, it is necessary to organically combine database analytics with technical indicators. The following steps can be referenced:
Step 1: Data Acquisition and Cleaning
Obtain historical price and volume data from public data sources and clean them by handling missing values and outliers. This step is the foundation for subsequent analysis.
Step 2: Feature Engineering
Use database analytics tools to calculate various statistical features, such as volatility, momentum, and correlation. At the same time, compute technical indicator values, such as MA, RSI, and Bollinger Bands.
Step 3: Strategy Backtesting
Combine features and indicators into trading signals and backtest them on historical data. During backtesting, care must be taken to avoid overfitting and to use out-of-sample data to validate the robustness of the strategy.
Step 4: Risk Management
Set reasonable stop-loss, take-profit, and position sizing rules to control the risk exposure of each trade.
Example: Backtesting a Strategy with Public Data
Suppose we use historical data of a certain stock (e.g., AAPL) and combine the crossover of the 50-day and 200-day moving averages as a signal. Buy when the 50-day MA crosses above the 200-day MA, and sell when it crosses below. Through database analytics, we can quickly calculate the historical performance of this strategy, such as cumulative return and maximum drawdown.
However, it must be emphasized: simulated results are for reference only, and history does not represent the future. Any strategy must undergo rigorous validation and risk assessment before practical application.
Enhancing Strategy Development Efficiency and Consistency
Database analytics not only accelerates data processing but also improves consistency in strategy development through standardized query and calculation processes. For example, encapsulating commonly used feature calculations into reusable queries or views can reduce repetitive work and allow researchers to focus more on strategy logic innovation.
BullSight Quant's Data Analysis Resources
BullSight Quant is dedicated to providing rich data analysis resources for quantitative learners. Whether it's guides on using database analytics tools or examples of technical indicator calculations, you can find them on our platform. We believe that through education and exchange, we can help more people master the methods of building quantitative decision frameworks.
Conclusion
In the era of AI revolution and big data, the combination of database analytics and technical indicators brings new breakthroughs to quantitative trading. Mastering these tools and methods will help enhance the efficiency and consistency of trading strategy development. Explore BullSight Quant's resources now and start your quantitative learning journey.
Disclaimer: This article is for educational and technical exchange purposes only and does not constitute any investment advice or solicitation. Backtest and simulated results do not represent future performance. Investing involves risks; please carefully evaluate your own situation.
<!-- info-disclaimer-appended -->
[Important Notice and Disclaimer] (DRAFT — pending legal review)
Technical and academic use only: All materials, code, quantitative models, charts and backtest results on this site/article are for general technical discussion, academic research and education only.
This site is not a licensed corporation of the China Securities Regulatory Commission or the Securities and Futures Commission of Hong Kong (SFC), and nothing herein constitutes investment advice, an offer or a solicitation in respect of securities, futures, options, virtual assets or other financial products. Past backtests do not predict future results: any strategy results shown are simulated from historical data and do not represent or guarantee future trading performance. Markets involve risk; models may fail due to regime change, data lag, slippage or system delay.
Invest at your own risk: Before any investment decision, assess your own risk tolerance and consult an independently licensed adviser. The site and authors accept no legal or financial liability for losses arising from use of or reliance on the code, tools or materials herein.
Tickers as technical examples only: Any named securities are for illustrating quantitative methods, data handling or backtest workflows — not recommendations or ratings.
精选短评
尚无短评,欢迎留下第一则。
写短评
支持粗体、列表;勿贴外部脚本或图片
0 / 2000
提交后需审核才会公开显示