Quantitative Breakthroughs in the AI Revolution: Intelligent Evolution and Practical Applications of Technical Indicators
Explore how machine learning breathes new life into traditional indicators, from parameter optimization to composite signals, enhancing decision efficiency and risk management
Quantitative Breakthroughs in the AI Revolution: Intelligent Evolution and Practical Applications of Technical Indicators
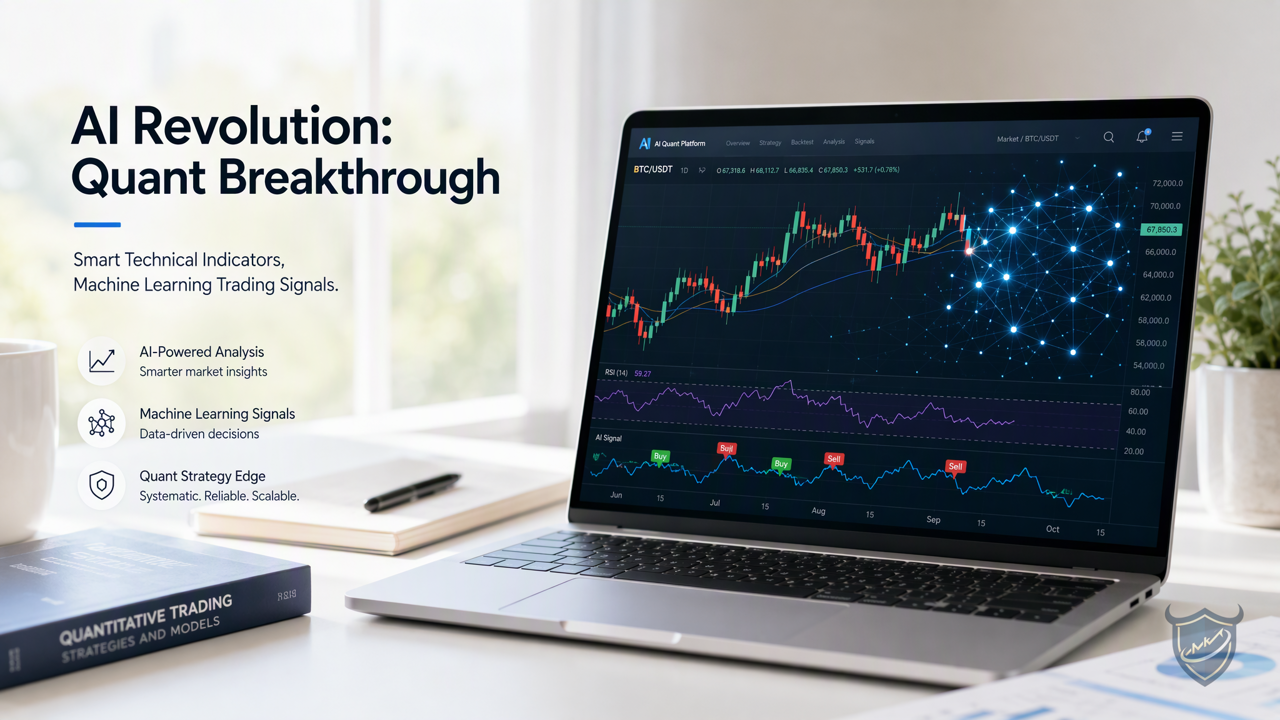
In the rapidly evolving financial markets, the AI revolution and quantitative breakthroughs are redefining the application of technical indicators. Traditional indicators such as moving averages and the Relative Strength Index (RSI) have long been core tools for trading decisions. However, with the rise of machine learning and artificial intelligence, these indicators are undergoing an intelligent evolution. This article explores, from a public knowledge perspective, how AI assists in identifying indicator patterns, optimizing parameter selection, and even generating composite signals to enhance decision efficiency. We will focus on use cases including day trading, swing trading, and risk management, and showcase how BullSight Quant helps users grasp these trends in a marketing style. Please note that this article is for educational and technical exchange only and does not constitute any investment advice.
Limitations of Traditional Technical Indicators
Technical indicators are statistical measures calculated from historical price and volume data to predict future price movements. However, traditional indicators face two major challenges: first, parameter selection often relies on experience or fixed rules, making it difficult to adapt to market changes; second, a single indicator can easily produce misleading signals, especially in volatile markets. For example, RSI may signal a reversal in overbought or oversold zones, but in strong trends, it may lead to premature exits. These limitations have prompted traders to seek more intelligent solutions.
How AI Revolutionizes the Application of Technical Indicators
The AI revolution brings a new perspective to technical indicators. Machine learning algorithms can learn patterns from large historical datasets, automatically adjust indicator parameters, and even generate new composite signals. Here are several key application directions:
Intelligent Parameter Optimization
Traditional parameter optimization is often done through grid search or genetic algorithms, but these methods are computationally intensive and prone to overfitting. Machine learning models can dynamically adjust parameters based on market conditions, for example, using reinforcement learning to find optimal parameter combinations. This not only improves indicator adaptability but also maintains robustness across different market environments.
Indicator Pattern Recognition
AI can assist in identifying specific patterns in technical indicators, such as divergences, crossovers, and head-and-shoulders formations. Through convolutional neural networks (CNNs) or recurrent neural networks (RNNs), models can automatically extract features from charts and classify these patterns. This helps traders quickly identify potential trading opportunities and reduce human errors.
Composite Signal Generation
A single indicator is often insufficient for reliable decisions. AI can integrate multiple indicators to generate composite signals. For example, using random forests or gradient boosted trees (GBT) to combine signals from RSI, MACD, and Bollinger Bands, and output a comprehensive score. This approach can improve signal accuracy and reduce interference from false signals.
Practical Scenarios: Day Trading, Swing Trading, and Risk Management
AI-enhanced technical indicators demonstrate advantages in various trading scenarios:
Day Trading
Day traders need quick decisions. AI can analyze indicator patterns in real-time and provide instant signals. For example, when RSI diverges from volume, the model may indicate a reversal opportunity. This helps traders capture short-term fluctuations.
Swing Trading
Swing traders hold positions for days to weeks. AI can optimize parameters to adapt to medium-term trends. For example, using machine learning to predict moving average crossovers and combining with market sentiment indicators to improve entry and exit timing.
Risk Management
AI can dynamically adjust stop-loss and take-profit levels based on indicator volatility. For example, when Bollinger Band width expands, the model may suggest widening the stop-loss to avoid being shaken out by short-term fluctuations. This enhances risk control.
BullSight Quant: Your Intelligent Trading Partner
In the wave of the AI revolution, BullSight Quant is dedicated to providing users with advanced quantitative tools and educational resources. Our platform integrates machine learning models to help you easily apply intelligent technical indicators. Whether for day trading or swing trading, BullSight Quant offers database analysis support, allowing you to focus on decision-making. We emphasize education and technical exchange and do not provide investment advice. Explore BullSight Quant today and master new directions in quantitative breakthroughs.
Conclusion
AI is reshaping the application of technical indicators, from parameter optimization to composite signals, bringing unprecedented decision efficiency to traders. However, historical data does not guarantee future performance, and readers should carefully assess risks. This article is for educational purposes only and does not constitute investment advice.
Disclaimer: The content of this article is for reference and educational purposes only and does not constitute any investment advice, offer, or solicitation. Securities trading involves risks, and past performance does not guarantee future returns. Readers should conduct their own independent research and consult professional advice when needed. BullSight Quant is not a licensed financial institution and is not responsible for any trading decisions.
<!-- info-disclaimer-appended -->
[Important Notice and Disclaimer] (DRAFT — pending legal review)
Technical and academic use only: All materials, code, quantitative models, charts and backtest results on this site/article are for general technical discussion, academic research and education only.
This site is not a licensed corporation of the China Securities Regulatory Commission or the Securities and Futures Commission of Hong Kong (SFC), and nothing herein constitutes investment advice, an offer or a solicitation in respect of securities, futures, options, virtual assets or other financial products. Past backtests do not predict future results: any strategy results shown are simulated from historical data and do not represent or guarantee future trading performance. Markets involve risk; models may fail due to regime change, data lag, slippage or system delay.
Invest at your own risk: Before any investment decision, assess your own risk tolerance and consult an independently licensed adviser. The site and authors accept no legal or financial liability for losses arising from use of or reliance on the code, tools or materials herein.
Tickers as technical examples only: Any named securities are for illustrating quantitative methods, data handling or backtest workflows — not recommendations or ratings.
Featured Reviews
No reviews yet. Be the first to leave one.
Write a review
Supports bold and lists; do not paste external scripts or images
0 / 2000
Visible after review